On March 23, 2023, the Arbitrum airdrop occurred, allowing many users to claim tokens. This airdrop coincided with the Arbitrum Foundation becoming a DAO, and new holders of the ARB token can vote on many aspects of the blockchain’s functionality and future. Naturally, this announcement drove users to Arbitrum, but how can we quantitatively visualize the usage and see how the airdrop affected other L2s? One method is to look at the amount of ARB tokens that were airdropped to various wallet addresses, but this requires the event to happen before analysis. What if we wanted to gauge the level of interest before the airdrop to take advantage of the opportunity? With Amberdata’s On-Chain data offering, we can measure the amount of ETH flowing into, or “bridging,” to another chain.
In this code example, we walk you through how to query the data and build the visuals of metrics such as the amount of ETH bridged to different L2’s, the number of daily unique depositors, the average deposit for those addresses, and more. Below are our analyses and visualizations of the impact the Arbitrum airdrop had on competitor L2s.
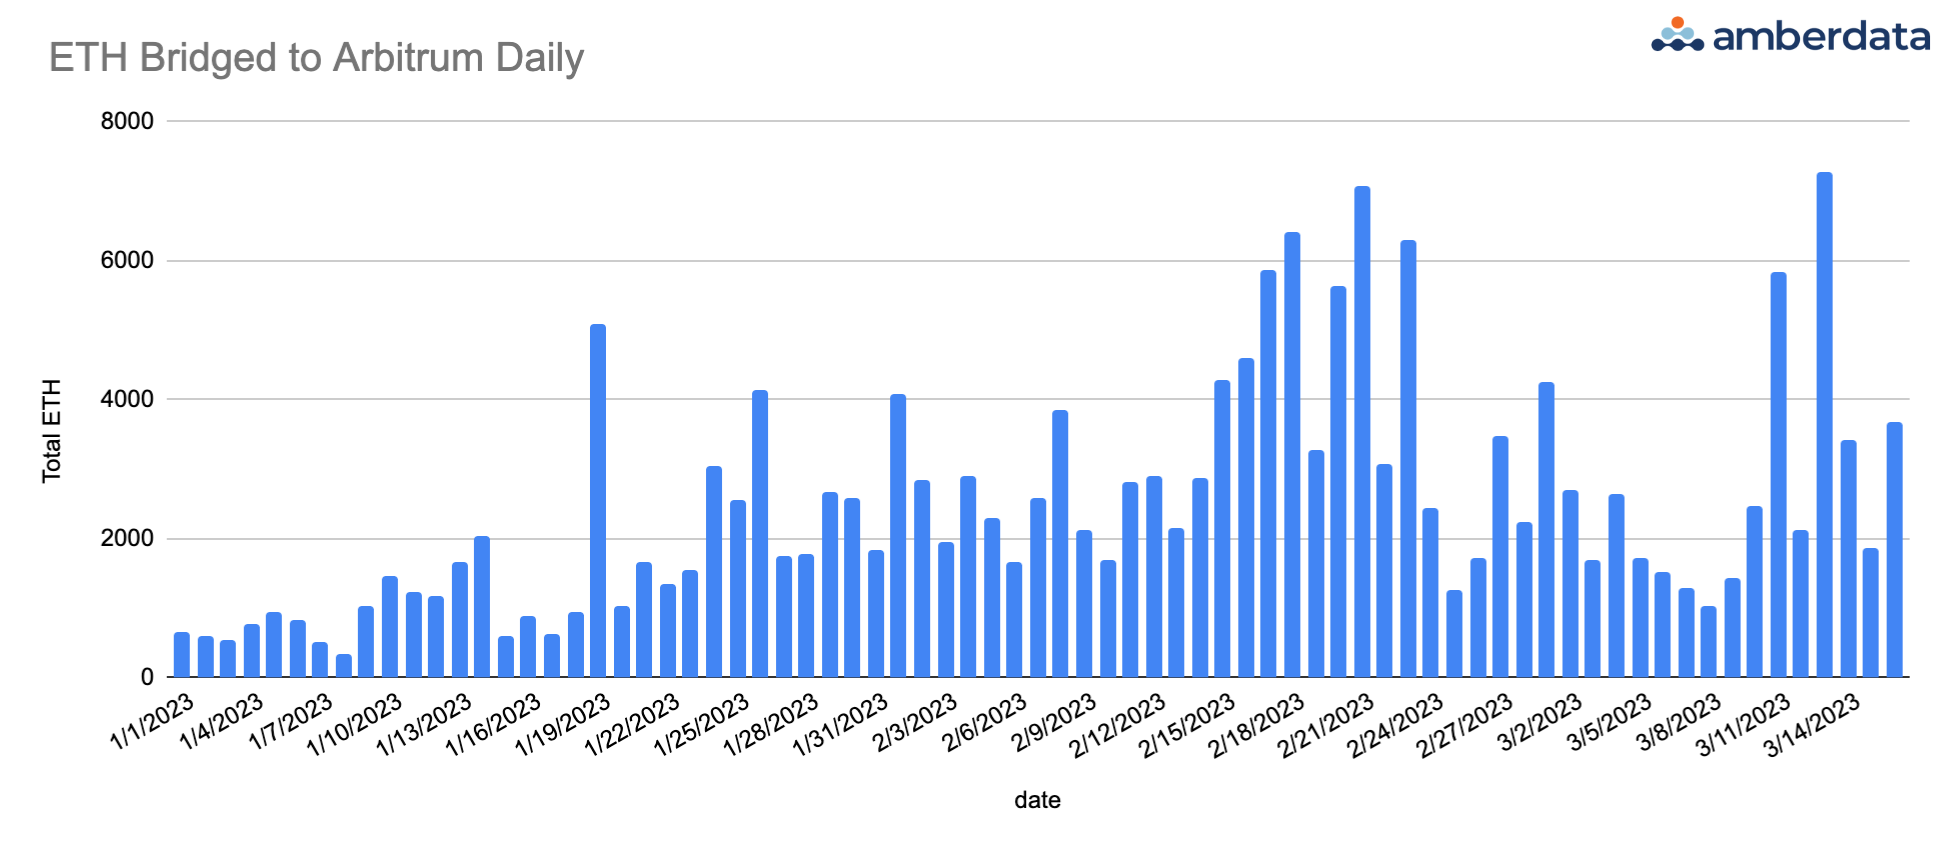
Above, we can see the amount of ETH bridged to Arbitrum, Starknet, and zkSync. Notice the significant spike for all three networks around March 16, 2023. While the Arbitrum airdrop was anticipated, the increase in Starknet and zkSync’s activity are likely users hoping the same thing will happen on those networks.
.png?width=1952&height=982&name=Untitled%20design-50%20(1).png)
Here we can see how many unique depositors there were on the three chains listed. Interestingly, in the days leading up to the Arbitrum airdrop, zkSync had more unique daily depositors than Arbitrum.
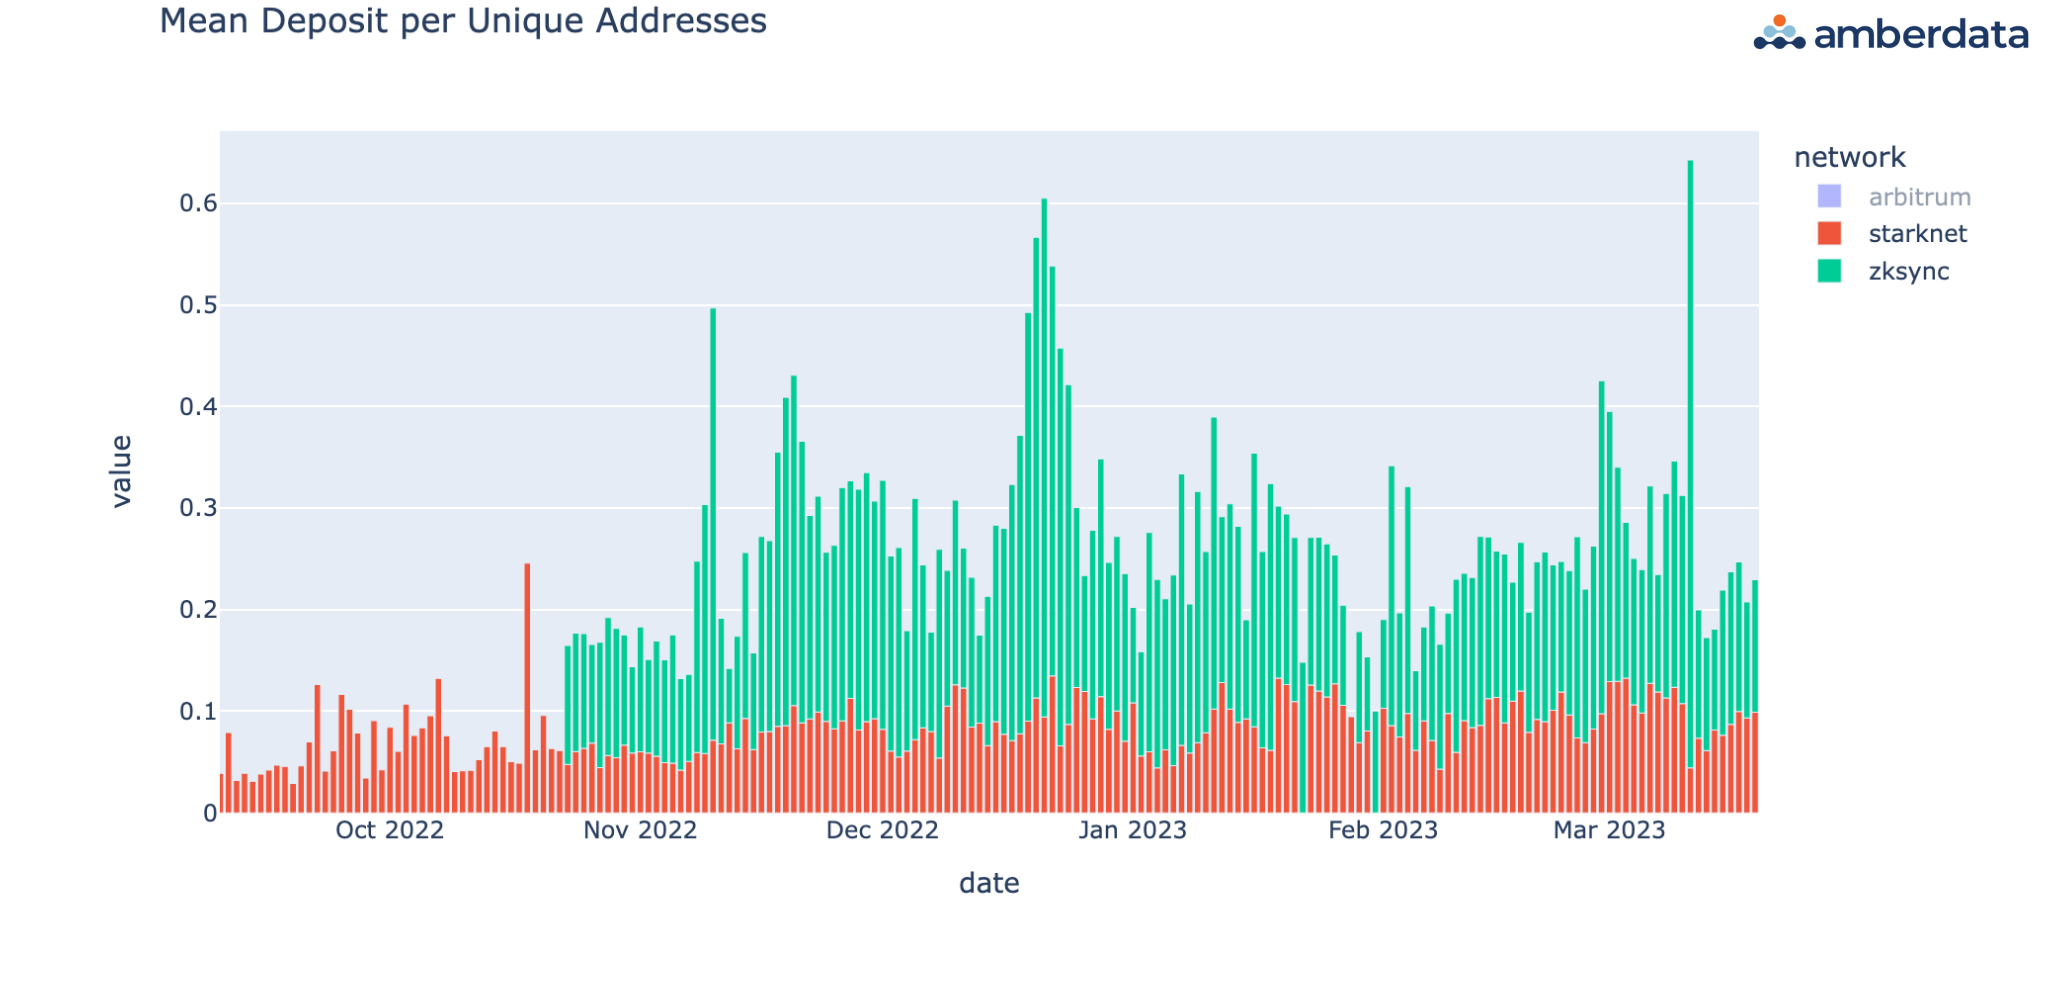
In this third chart, we can view the average Starknet and zkSync deposits per address. Notice how the zkSync spike in March matches the number of inflows from our first chart.
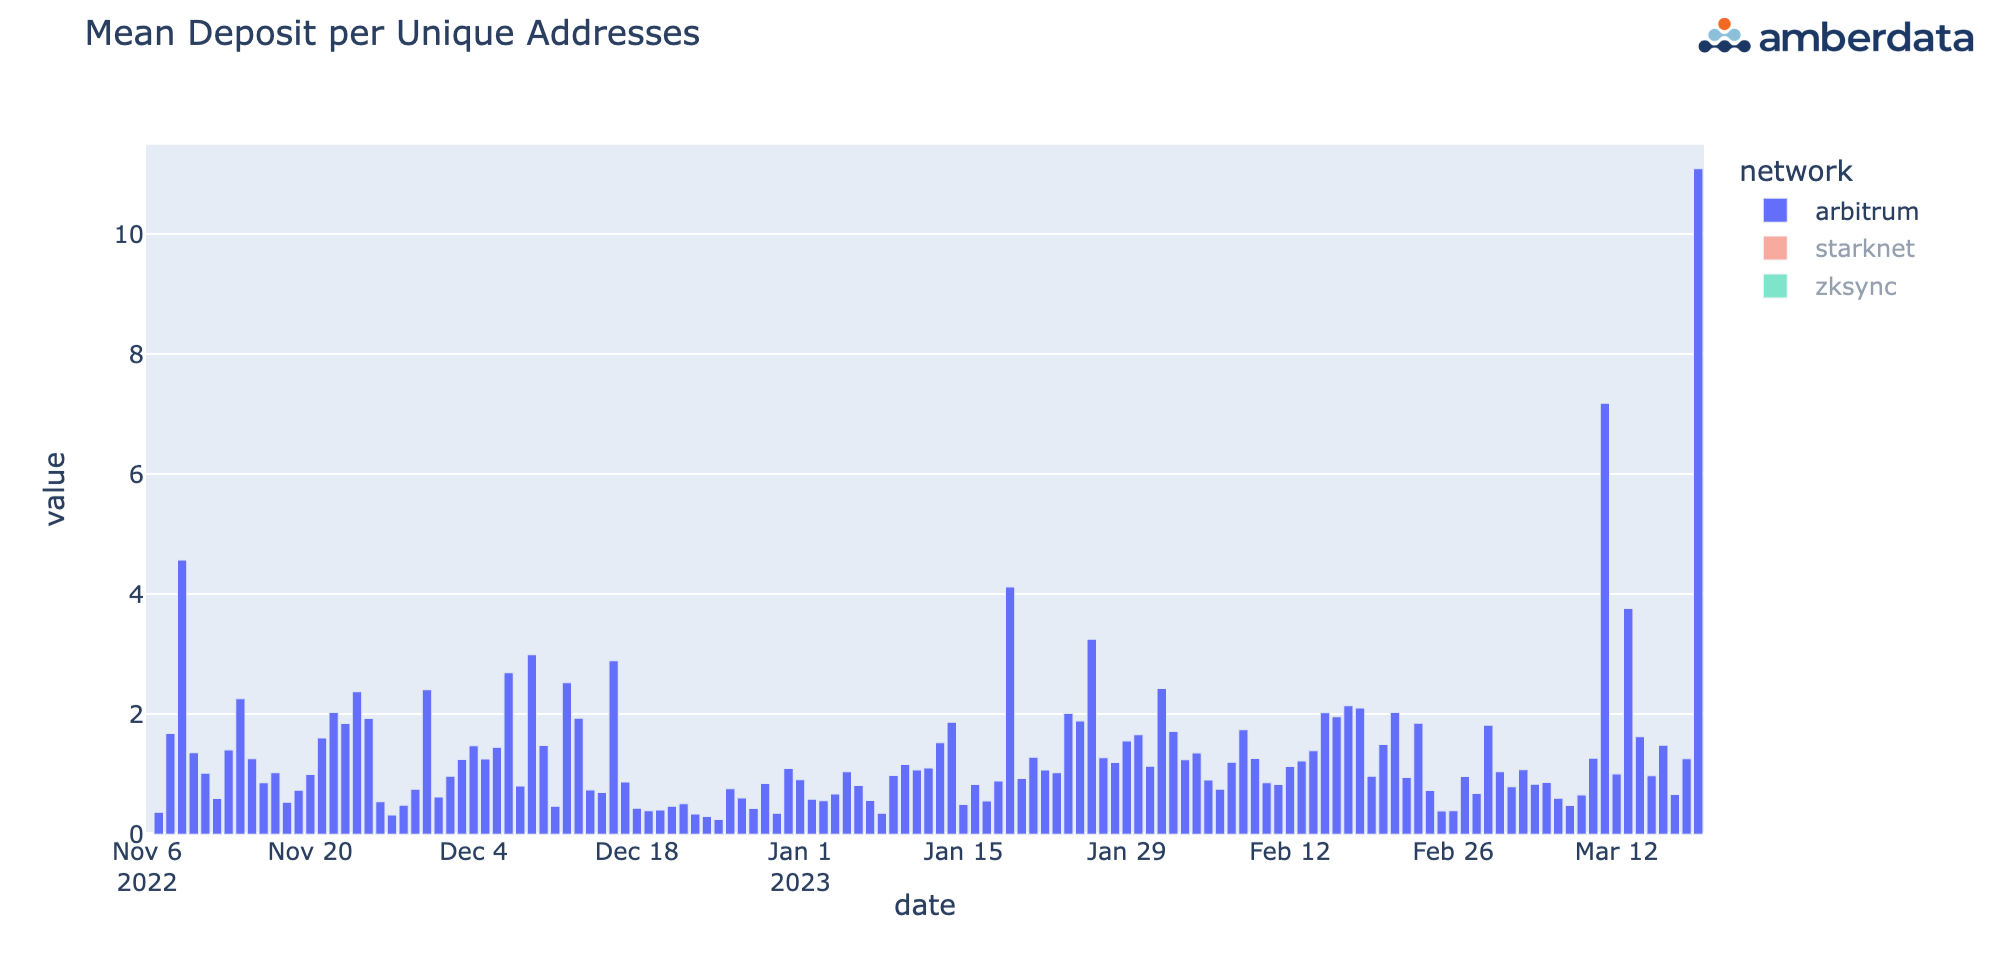
In our fourth chart, we can see the average Arbitrum deposits per address, which also matches the March inflows from the first chart.
The charts above are just a sample of what you can do with our extensive blockchain data. From exploring L2 deposits to investigating mempool data or stablecoin issuance, Amberdata’s On-Chain data elevates any analysis.